Quick Thoughts:
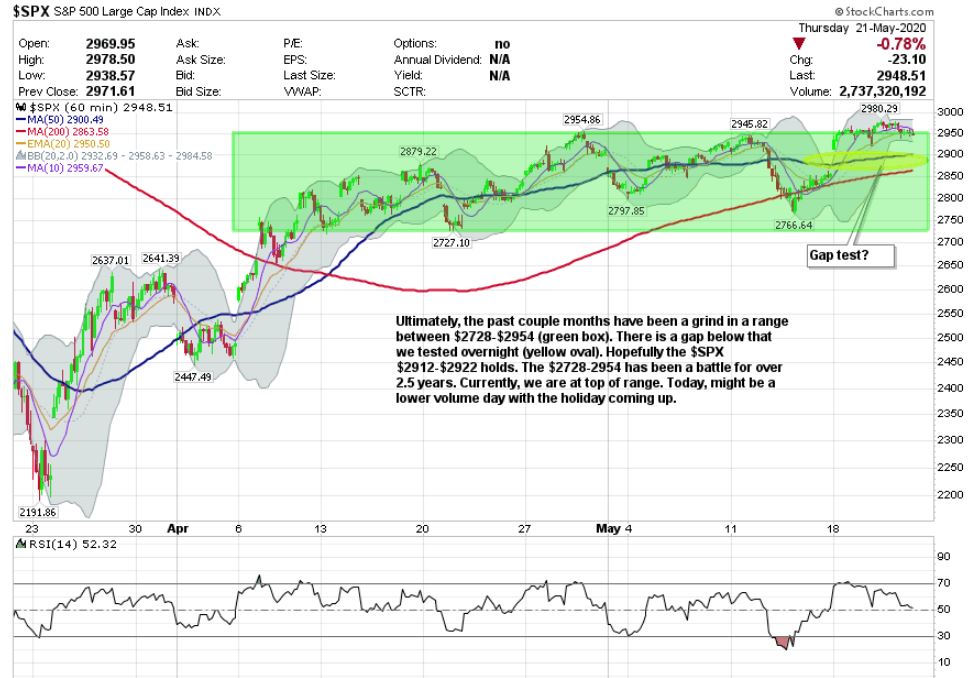
- Tech has been in “beast mode” as of late and has consolidated a bit as “beat to dead” names got a bid this week. The S&P 500 traded in a tight 70 point range between $2910-$2980 all week. We have stressed that sideways movement would be preferred. Currently, price action continues to be resilient. If $2910 fails to hold, $2850 could happen quickly. There is a big gap that could be tested.
- In reality, most of tech is overcrowded and is consolidating well as value/beaten down names are getting a bid. Overcrowded doesn’t mean we don’t go higher short-term. Risk to reward is really the question at hand. Financials and Industrials did hold-up decently this week, which is what we wanted to see.
- Short and to the point, we are range-bound between $2728-$2954. We may trade 3% +/ – on each side of this range, but it may be difficult to punch past $3028 short-term, barring another vaccine headline. It has been a reoccurring theme that Tech leads both to the upside and to the downside. The question is whether this is simply good consolidation or a start at a breakdown. Fundamentally, there are legitimate problems to workout. From a technical standpoint, price action has remained resilient.

Where in the heck are are headed?
| PROS | CONS |
| Price action remains resilient – Bullish (Most important of all!) | Many of the “stay at home” leaders are overcrowded – Bearish for the way we allocate. We trade based on the leaders. |
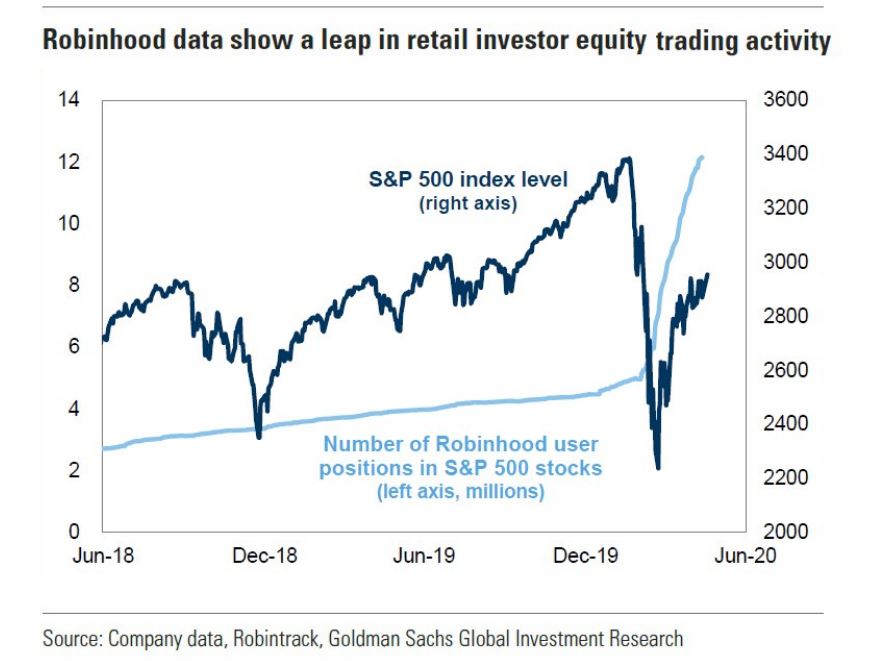
| There is over $5.0 Trillion of investors’ cash on the sidelines waiting to pounce – Bullish (overly pessimistic) | The Put/Call Ratio is a bit on the low side; meaning there is some complacency in the air. |
| The Street is interpreting horrendous jobless claims and layoffs as a bottoming. In other words, “Can it get much worse?” The difficult part with this theory is we are 30+% off the lows. | Most companies are eliminating guidance from their earnings calls, which may prove to be a bigger issue next quarter. OR will the Street give the earnings another “pass” like they did this quarter? |
| Crude oil has rebounded back over $30 dollars a barrel. | Many small companies will be permanently impacted from Covid. |
| Many of the “left for dead” names are starting to get a bid. This aids in providing time for leaders to consolidate. | Citigroup’s Sentiment Panic/Euphoria model is topping Euphoric levels we touched prior to (35)% dip. |
| All week we traded in a tight 70 point range. Ultimately, $2910 on the S&P 500 needs to hold. The grind at $2954 is REAL! | Usually, when you start to see a shift from bearish to bullish after a 30% rally, you can get a little extension, but it often leads to lower pricing (overcrowded or overbought levels). |
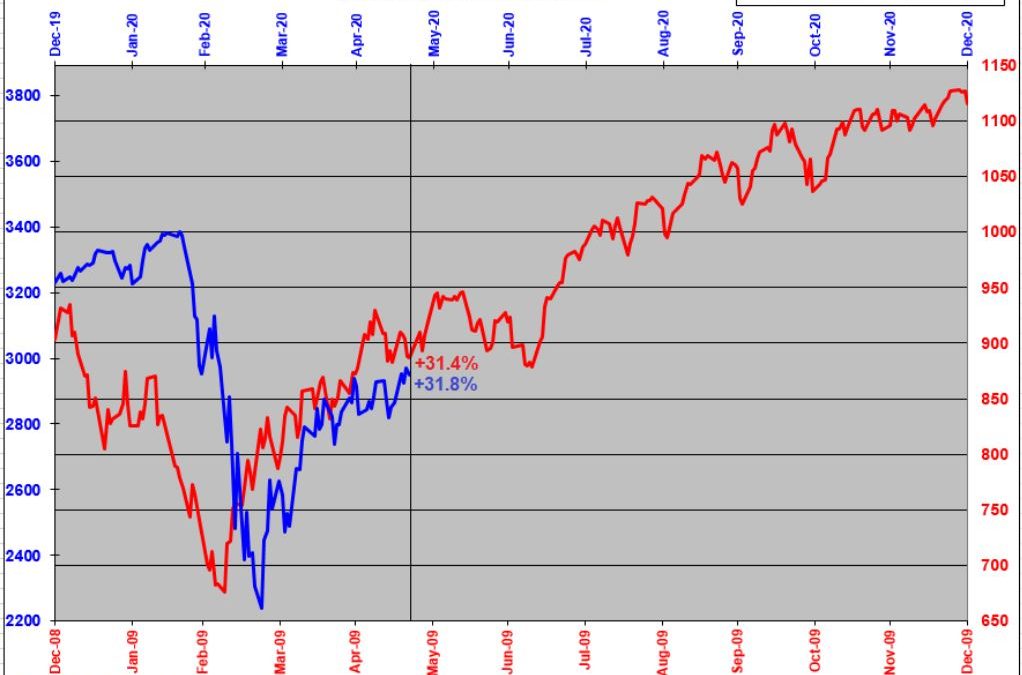
The point of this above exercise is to demonstrate how frustrating range-bound price action can be. I could show you 1000 reasons to prove we retest the lows and 1000 reasons to show you we will hit all-time highs before year-end. The point being, don’t become overly bearish or bullish. There are problems fundamentally, but the market is responding well to the problems. A line that we continue to push is, “the market is not the economy!” You’ll never be a good investor until you understand this. We have also stressed how the market will bottom before the economy does. I think this is pretty self explanatory since we are 32% off the lows and the economic numbers continue to worsen. Are we overbought here? Probably! Though the reality is, is there is so much in cash that could be put to work that could keep us range-bound for quite some time. We continue to battle the $2728 to $2954 range that we have continuously tested for 2.5 years. It’s going to be frustrating. Expect it. Just when you think it is comfortable, the market will test lower. It’s a reoccurring theme.
Going forward, we will likely hold our positions unless $2910 doesn’t hold. I wouldn’t mind lower pricing to ensure the move is more sustainable. The longer we consolidate in this range, the larger the bull rally will likely be on the back end. So, while many will get frustrated with seeing values the same for extended periods and give-up, this is when we tend to see the largest rallies in history. In other words, this frustration will eventually lead to good things. Hang in there and be thankful that the market has rallied as far as it has. We continue to remain cautious in our allocation with the leaders needing consolidation. Overall, price action tells the story and from this perspective, it has been impressive. The real question is how long can it last? We will continue to grind! Have a great extended weekend.
Interesting Chart Perspective:


We are here for you. Reach out should you have questions or concerns!
==================
Follow us for daily updates: Twitter: @jonathan_gurney OR @gurneyfinancial Linked-In: Jonathan M. Gurney Facebook: Jonathan Micah Gurney OR Gurney Financial LLC Instagram: Jonathan M. Gurney
DISCLOSURE STATEMENT
This post is for informational use only. The views expressed are those of the author, Jonathan M. Gurney. This material is not intended to be relied upon as a forecast, research, or investment advice, and it is not a recommendation, offer or solicitation to buy or sell any securities or to adopt any investment strategy.
Opinions and statements of financial market trends that are based on current market conditions constitute judgment of the author and are subject to change without notice. Statements that reflect projections or expectations of future financial or economic performance of the markets may be considered forward-looking statements. Actual results may differ significantly. Any forecasts contained in this material are based on various estimates and assumptions, and there can be no assurance that such estimates or assumptions will prove accurate.
Investing involves risk, including possible loss of principal. Past performance is no guarantee of future results. All information referenced in preparation of this material has been obtained from sources believed to be reliable, but accuracy and completeness are not guaranteed.